Lab Overview
Lab at a Glance
index=_internal, and interpret real internal log data including MongoDB sourcetype eventsindex=_internal | stats count by sourcetype · index=_internal sourcetype=mongod · index=main errorIn this lab you will take your very first steps inside a real, production-grade Security Information and Event Management (SIEM) platform. Unlike theoretical introductions, every step here is performed live — you will sign up for a real Splunk Cloud account, receive genuine credentials via email, log in to a real cloud environment, and immediately begin querying real data that Splunk is generating internally about its own operations.
By the end of this 45-minute session you will have moved from zero knowledge of Splunk to being able to independently write basic SPL queries, interpret a statistics table of log event counts, and explain what the data is telling you — skills that form the bedrock of any SOC analyst role.
One of the biggest advantages of Splunk Cloud Platform over the on-premises version is that it requires nothing installed on your local machine. Everything runs in your web browser. This makes it perfect for classroom use, as every student starts with an identical, clean environment regardless of their local operating system.
What is Splunk? — Core Theory
Before we touch the platform, let's establish the foundational concepts you will encounter throughout this lab series. Understanding the why behind each concept makes the hands-on steps far more meaningful — and sticks in memory long after the session ends.
What is a SIEM?
A Security Information and Event Management (SIEM) platform is the central nervous system of a modern Security Operations Centre (SOC). It collects log data from every device on a network — servers, firewalls, workstations, applications, cloud services — aggregates it into a single searchable repository, and provides tools to detect, investigate, and respond to security incidents in real time.
Think of it this way: every system on a network is constantly writing a diary of everything it does. A SIEM reads every one of those diaries simultaneously and can instantly answer questions like: "Which device generated the most error messages in the last hour?" or "Did any account log in from two countries within 10 minutes?"
Core Concept Index
An index in Splunk is like a database table — it is the container where raw log data is stored after being ingested. When you run index=main, you are telling Splunk to search only within that specific storage bucket. Using separate indexes for different log types (e.g., linux_auth for SSH logs, web_access for Apache logs) improves search performance and enables per-index access controls.
Core Concept Sourcetype
A sourcetype tells Splunk what kind of data it is receiving — the format, structure, and how to extract fields from it automatically. For example, the sourcetype access_combined tells Splunk it is reading Apache web server logs, so it knows to extract fields like clientip, method, uri_path, status, and bytes automatically. Without correct sourcetype assignment, logs arrive as unstructured raw text with no searchable fields.
Core Concept SPL (Search Processing Language)
SPL is Splunk's query language — the tool you use to ask questions of your data. It works as a pipeline: raw data enters on the left, and each command connected by a pipe (|) transforms the results. For example: index=main | stats count by src_ip | sort -count reads "from the main index, count events grouped by source IP, then sort largest first." SPL is intentionally approachable — it reads almost like plain English.
Core Concept index=_internal
The _internal index is Splunk's own internal log store — it records everything Splunk itself is doing: search activity, data ingestion rates, scheduler performance, and internal service logs. It always contains data the moment Splunk starts, making it ideal for learning SPL queries without needing to upload any external log files. In this lab, _internal is your training dataset.
| Actually WorksIn Unix/Linux, the pipe operator | passes the output of one command as the input of the next — for example, cat auth.log | grep "Failed" | sort | uniq -c. SPL uses exactly the same principle. In index=_internal | stats count by sourcetype, Splunk first retrieves all matching raw events from the index, then passes that entire result set into the stats command which performs the aggregation. Every subsequent pipe adds a new transformation stage — | sort, | head 10, | eval, | rex — each receiving the full output of the previous command as its input. This is why SPL queries must always be read strictly left to right: the order of pipe stages directly determines the final output, and swapping two stages produces a completely different result.
Step 1 — Sign Up for the Splunk Cloud Free Trial
Navigate to the Splunk Cloud Platform trial registration page. Splunk offers a generous 14-day free trial with no credit card required — you simply provide your name, email, and job details. The trial gives you full access to Splunk Cloud Platform with a 5 GB per day ingest limit, which is more than sufficient for lab work.
Open your browser and go to:
https://www.splunk.com/en_us/download/splunk-cloud.html
Complete the registration form with the following fields. Use your academic or institutional email address for best results — some free webmail providers may trigger additional verification steps.
| Field | What to Enter | Notes |
|---|---|---|
| Business Email | Your academic or institutional email | Use .edu.au or institution email for faster approval |
| Password | Minimum 8 characters, mixed case + number | This is your Splunk account password, not the cloud password |
| First Name / Last Name | Your full name | Used in your welcome email and Splunk profile |
| Job Title | Lecturer / Student / IT Professional | Splunk uses this for product recommendations |
| Phone Number | Your contact number | Optional but speeds up any support requests |
| Company | Your institution or organisation name | e.g., Academies Australasia / University of Canberra |
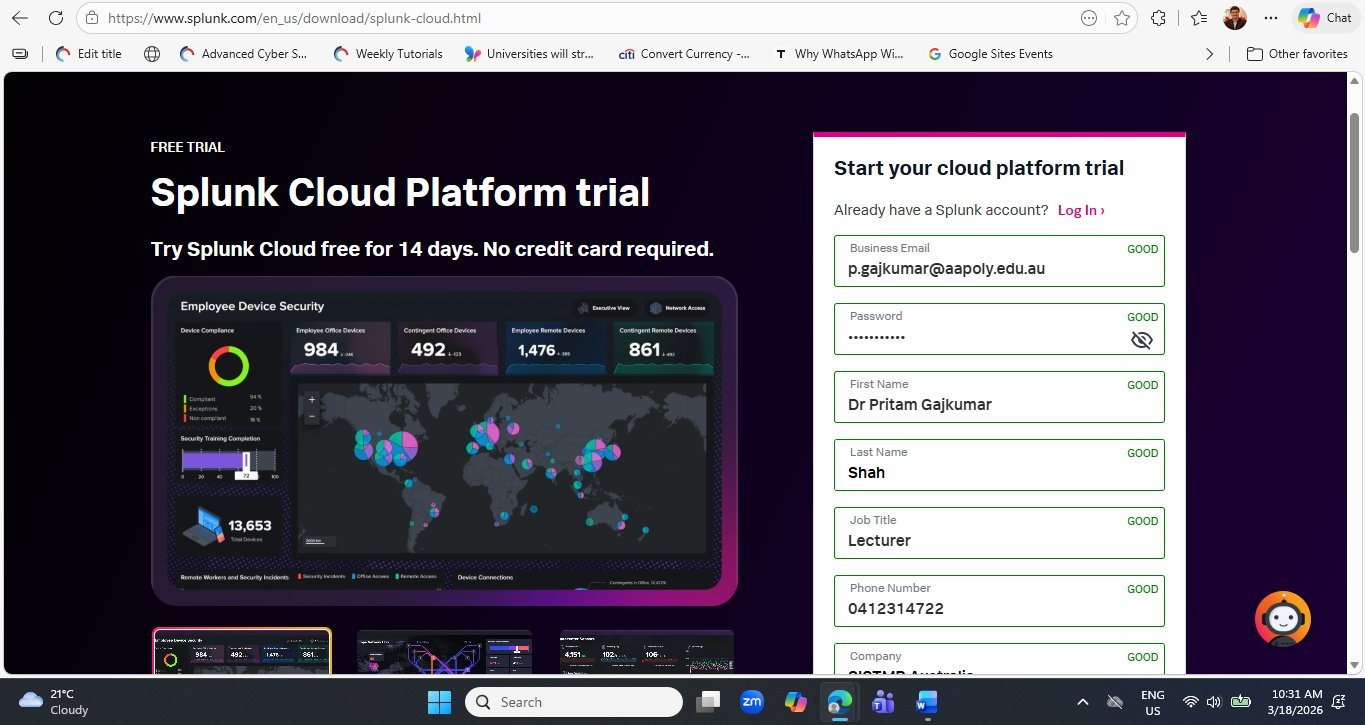
Once all fields are marked GOOD in green, scroll down and click the Start Your Free Trial button. Splunk will immediately send two emails — the first within seconds to verify your email address.
Both the verification email and the credentials email can land in spam or promotions folders, especially with institutional email addresses that have strict filtering. If you do not see the emails within 5 minutes, check your junk folder before re-submitting the form. Re-submitting with the same email will create a duplicate account request.
Step 2 — Verify Your Email Address
Within seconds of submitting the form, Splunk sends a verification email. This is a standard two-step registration process — Splunk needs to confirm your email address is valid before provisioning a cloud environment on your behalf.
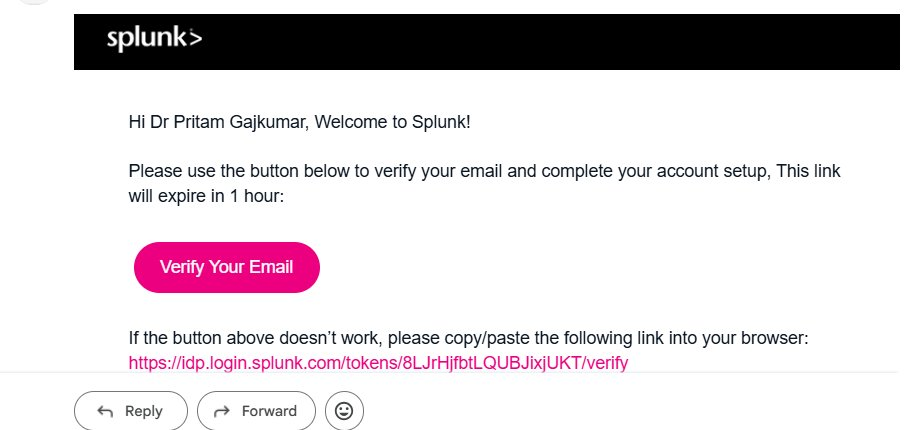
Click the Verify Your Email button. This opens a Splunk page confirming your email is verified. Importantly, this verification does not give you access to Splunk Cloud yet — it only confirms your email. The actual cloud environment provisioning begins in the background and takes approximately 10–15 minutes.
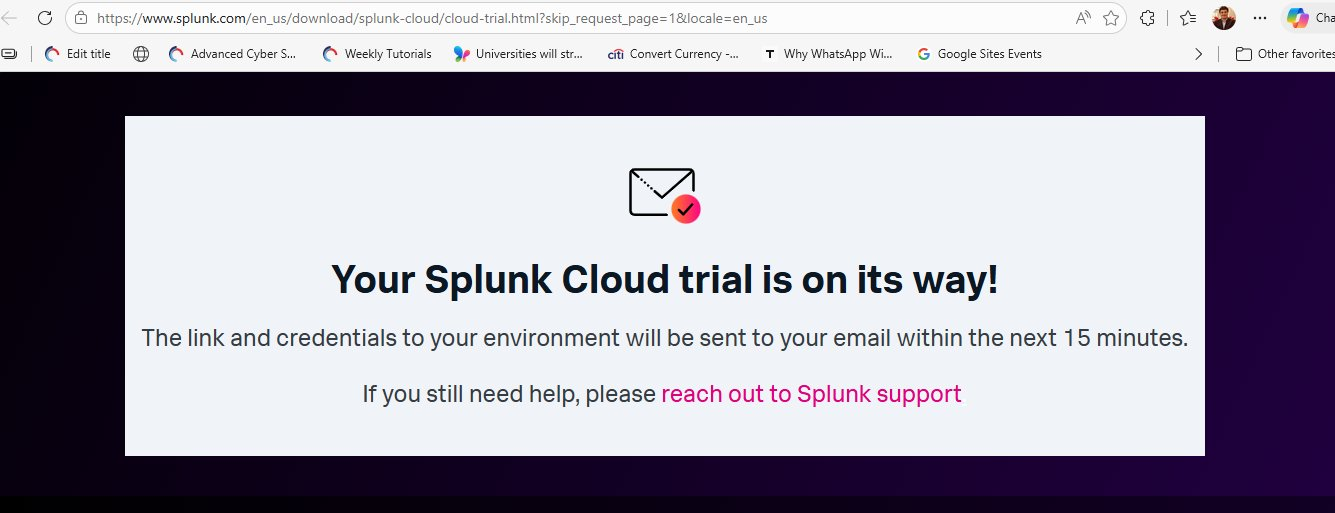
Splunk is not simply creating a user account — it is spinning up a dedicated Splunk Cloud Platform instance on AWS (Amazon Web Services) infrastructure with a unique subdomain assigned specifically to you (e.g., prd-p-eydlo.splunkcloud.com). Each trial customer receives their own isolated cloud tenant. This is why the provisioning takes a few minutes rather than being instantaneous.
Step 3 — Receive Your Splunk Cloud Credentials
After approximately 10–15 minutes, Splunk sends a second email titled "Welcome to Splunk Cloud Platform!". This email contains the three pieces of information you need to access your cloud environment for the first time.
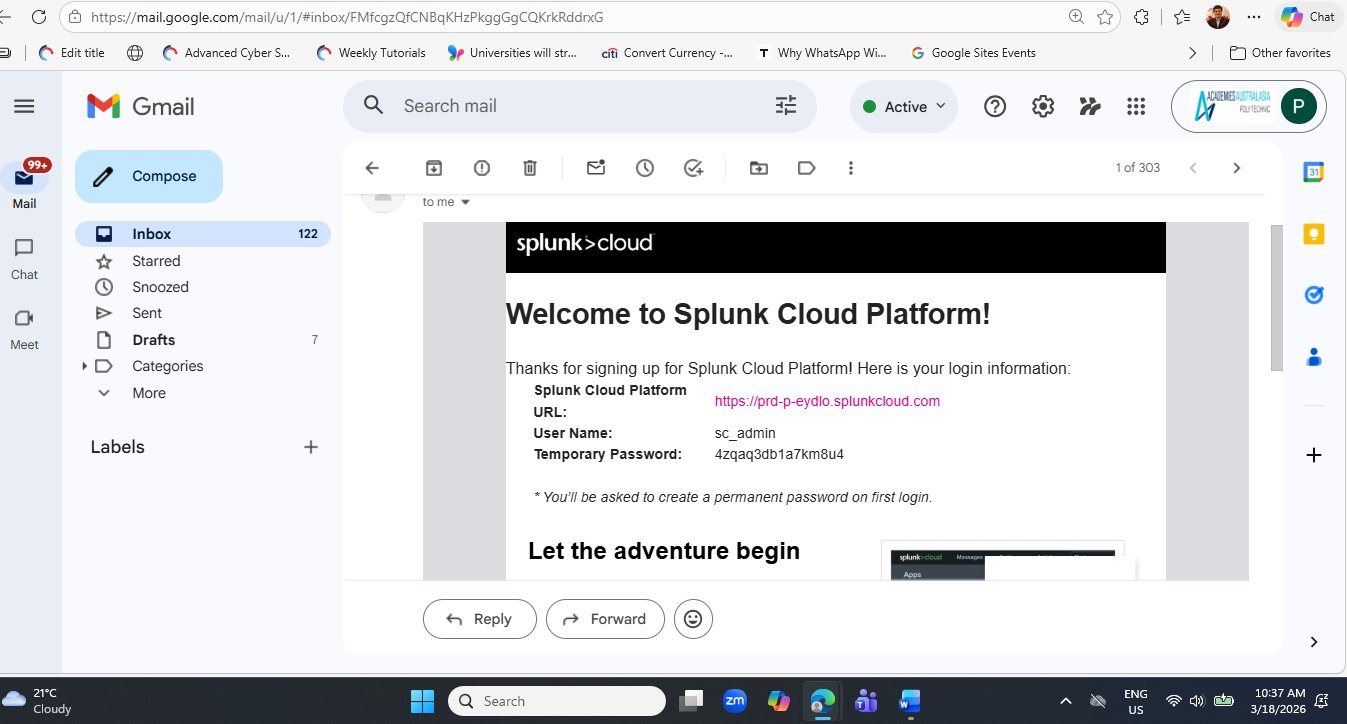
prd-p-eydlo.splunkcloud.com), the default username (sc_admin), and a randomly generated temporary password. Keep this email accessible — you will need the URL again if your browser session expires.The temporary password shown in the email (like 4zqaq3db1a7km8u4) must be changed on first login. Never share this email with others and do not screenshot it for public distribution. Your Splunk Cloud URL is also unique to your account — sharing it would allow others to attempt to log into your environment. For this lab article, the credentials shown are from a controlled demonstration account.
Step 4 — First Login and Password Change
Click the Splunk Cloud URL from the credentials email (or paste it into your browser). You will be directed to the Splunk Cloud login page, which has a distinctive dark background overlaid with streaming web access log data — a visual that immediately communicates what Splunk is about: making sense of raw log streams.
Enter the temporary password from the email. Splunk will immediately redirect you to a mandatory password change screen.
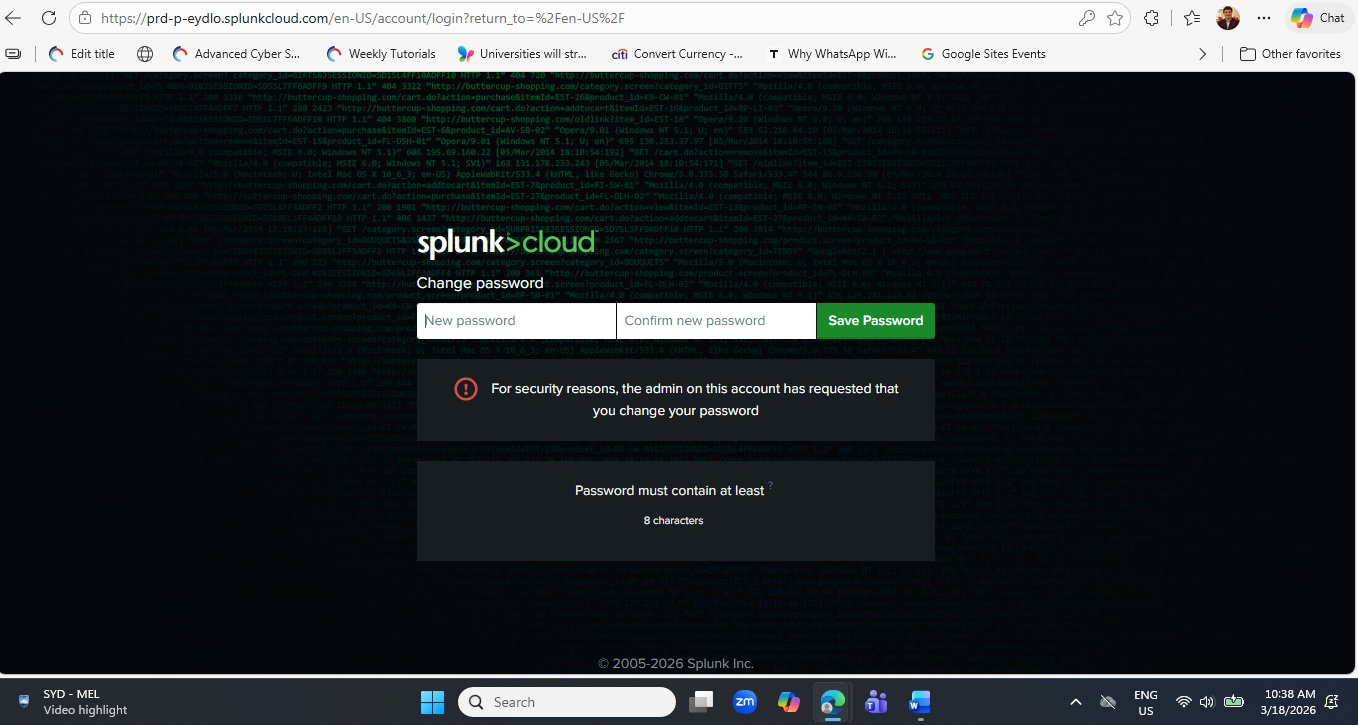
The forced password change on first login is itself a security best practice lesson. The message "the admin on this account has requested that you change your password" reflects a real-world enterprise policy: service accounts and new user accounts should always use temporary credentials that expire immediately on first use. This prevents vendor-set default passwords from remaining active in your environment.
Choose a strong, memorable password of at least 8 characters. Click Save Password. Splunk will immediately log you in and redirect you to the Splunk Cloud home page.
Step 5 — Navigating the Splunk Cloud Home Page
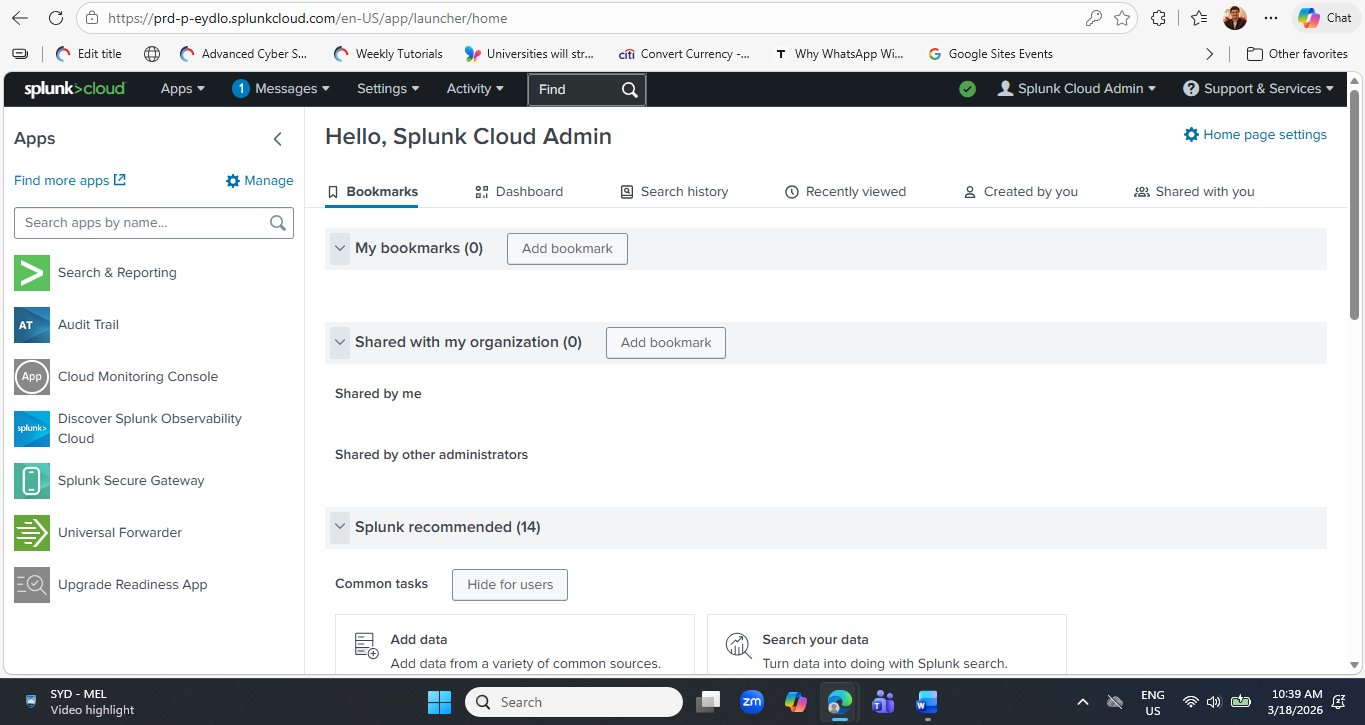
After setting your password, you arrive at the Splunk Cloud Platform home page. Take a moment to orientate yourself before diving into search — understanding the layout will save you time throughout every future lab session.
Here is a quick orientation to the key areas you will use throughout this lab series:
| UI Element | Location | Purpose |
|---|---|---|
| Search & Reporting | Left Apps panel | The primary workspace for writing SPL queries, viewing results, and building dashboards. This is where 90% of your lab work happens. |
| Audit Trail | Left Apps panel | Records all administrative actions taken in your Splunk environment — who did what, and when. |
| Cloud Monitoring Console | Left Apps panel | Shows the health and performance of your Splunk Cloud instance — indexing rates, search load, and license usage. |
| Universal Forwarder | Left Apps panel | The lightweight agent you install on remote systems to ship logs to Splunk Cloud. Used in more advanced labs. |
| Settings | Top navigation bar | Manage indexes, data inputs, users, roles, and lookups. |
| Add Data | Home → Common tasks | Shortcut to configure new data sources — upload files, monitor directories, or add network inputs. |
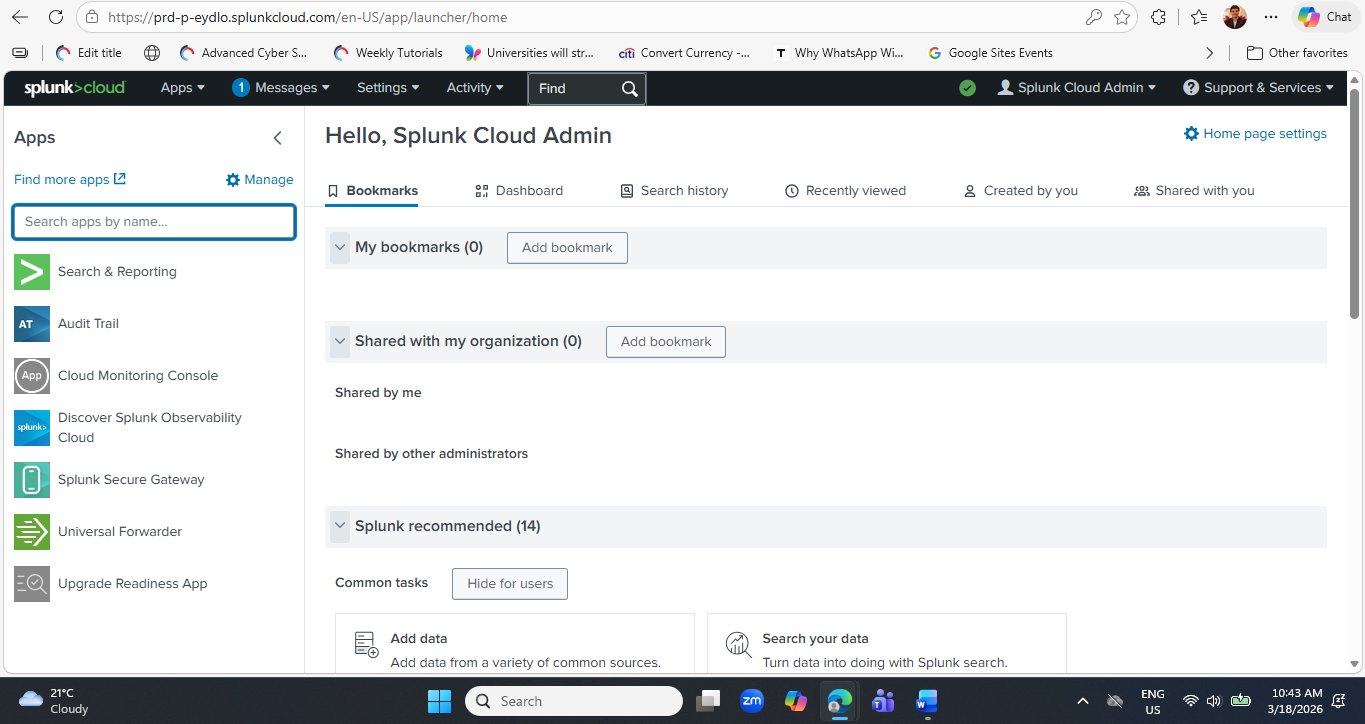
Click Search & Reporting in the left panel now and bookmark it in your browser. Every lab in this series begins with Search & Reporting. Having it one click away from your browser bookmark bar will save you navigating back to the home page at the start of every session.
Step 6 — Running Your First SPL Query
Click Search & Reporting in the left panel. The Search & Reporting app opens with a large search bar at the top and a navigation bar showing Search, Analytics, Datasets, Reports, Alerts, Dashboards and Modules. This is where everything in Splunk happens.
Click inside the search bar and type (or paste) the following query exactly as shown:
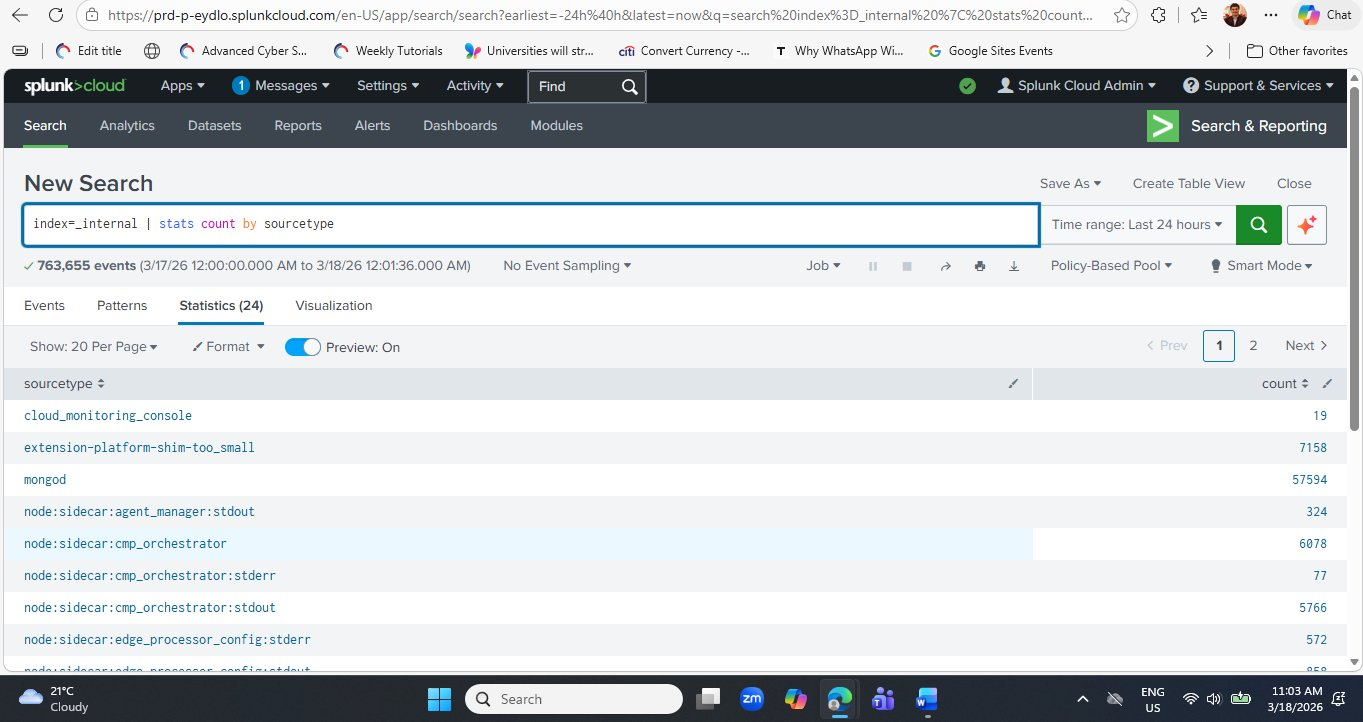
index=_internal | stats count by sourcetype
Set the time range to Last 24 hours using the time picker on the right of the search bar, then click the green Search button (or press Enter).
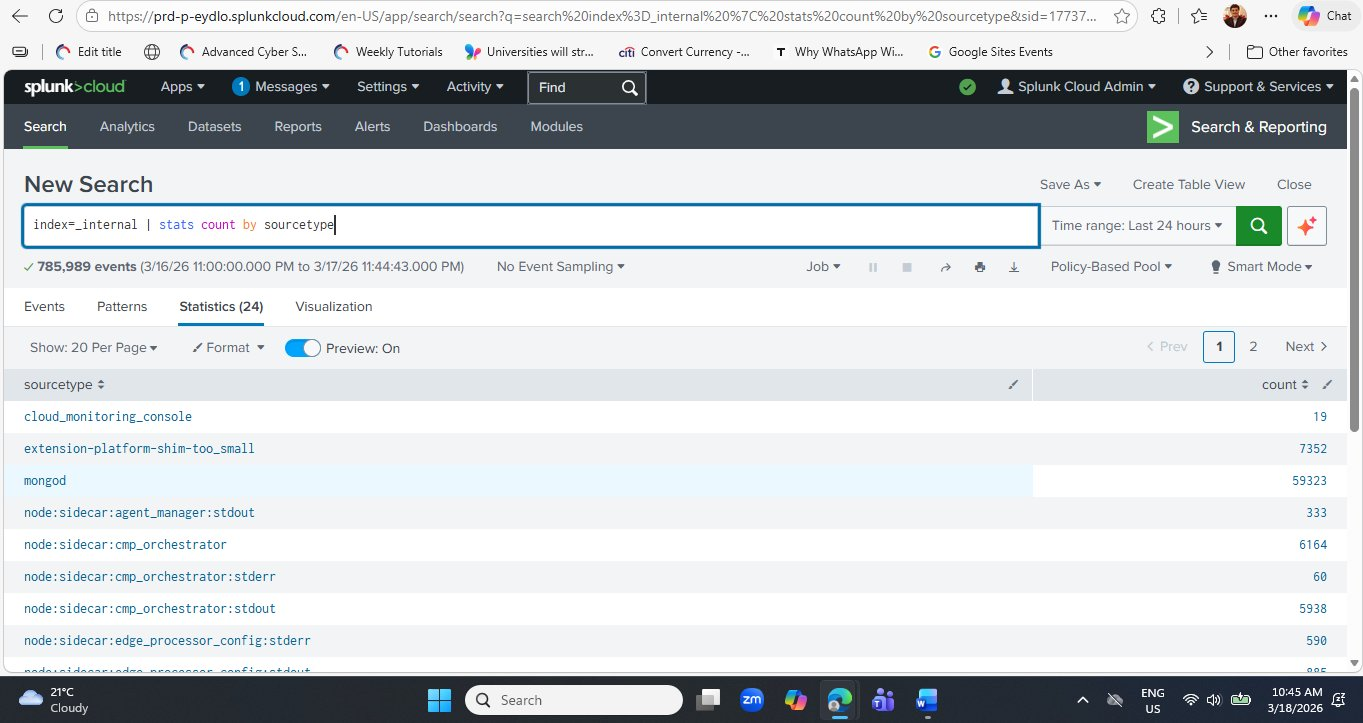
_internal index over the last 24 hours. The Statistics tab shows each sourcetype and its event count. The green progress bar at the top indicates the search completed successfully. Note the Statistics (24) tab label — there are 24 distinct sourcetypes present in this Splunk Cloud environment.Now let's understand exactly what each part of this query does:
stats command performs statistical aggregations — similar to SQL's GROUP BY. Here it counts the total number of log events (count) and groups the results by the sourcetype field. The output is a two-column table: one column for sourcetype names, one for their event counts.Step 7 — Sort Results by Count (Highest First)
Click the count column header in the results table to sort from highest to lowest. This immediately shows you which component of Splunk is generating the most log activity — crucial for understanding where to focus investigation in any log analysis scenario.
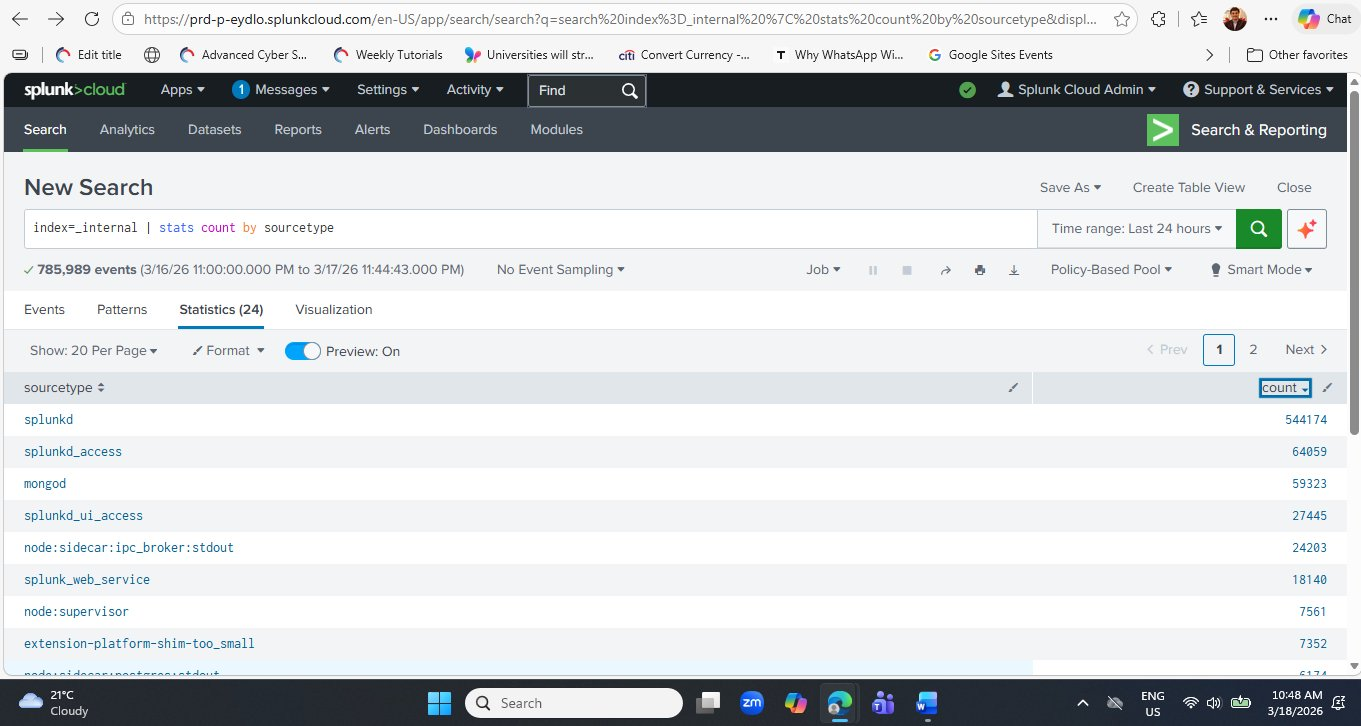
Here is what each major sourcetype in your results represents:
| # | Sourcetype | Count (approx.) | What It Represents |
|---|---|---|---|
| 1 | splunkd | 544,174 | The Splunk daemon — Splunk's core engine. Logs every internal operation: indexing, searching, scheduling, and system health events. Always the highest-count sourcetype. |
| 2 | splunkd_access | 64,059 | Access logs for the Splunk REST API. Every API call (including from the Web UI) generates an entry here — similar to an Apache access log but for Splunk's own API. |
| 3 | mongod | 59,323 | MongoDB database logs. Splunk uses MongoDB internally to store configuration, knowledge objects, and app metadata. High counts are completely normal. |
| 4 | splunkd_ui_access | 27,445 | Web UI access logs — records every page you load in the Splunk Web interface. Your own browsing activity appears here. |
| 5 | node:sidecar:ipc_broker | 24,203 | Splunk Cloud internal microservice communication logs — the inter-process communication broker that coordinates Splunk Cloud's containerised architecture. |
| 6 | splunk_web_service | 18,140 | Splunk Web server logs — the Python CherryPy web framework that serves the Splunk Web interface generates these entries. |
Understanding Sourcetypes — The Key to Log Analysis
The sourcetype column you have just seen is one of the most important concepts in all of Splunk. Every single event in Splunk has a sourcetype assigned to it, and that assignment determines how Splunk parses, displays, and allows you to search that event's data.
Pattern Splunk Internal Sourcetypes
Any sourcetype starting with splunkd, splunk_, or node: is generated by Splunk itself and lives in index=_internal. These are diagnostic logs that Splunk engineers and administrators use to troubleshoot the platform. In your SOC work, you will rarely query these — but they are always available as training data.
Pattern External Data Sourcetypes
When you upload your own log files (in Step 11 of this lab), Splunk will ask you to assign a sourcetype. For Apache web logs use access_combined. For Linux auth logs use linux_secure. For Windows Event Logs use WinEventLog:Security. Correct sourcetype assignment unlocks automatic field extraction — the difference between a raw text blob and a fully searchable structured event.
Pattern Using Stats to Audit Your Data
The query index=_internal | stats count by sourcetype is not just a learning exercise — it is a genuine operational query. Every time you configure a new data source, run this query (substituting your index name) to verify events are actually flowing in, confirm the correct sourcetype was applied, and check that event volumes are within expected ranges. It takes 5 seconds and catches configuration errors immediately.
Step 9 — Viewing Raw Events & Exploring the Timeline
So far you have been looking at the Statistics tab — aggregated counts. Now let's switch to the Events tab to see the raw, individual log records that power those counts. This is one of the most important skills in Splunk: knowing when to use Statistics (for counting and aggregating) versus Events (for reading the actual content of individual log entries).
Run the simple query below — no pipe, no aggregation — to retrieve all raw events from the internal index:
index=_internal
Click the Events tab (the first tab, to the left of Patterns and Statistics). Splunk returns every matching event in reverse-chronological order — most recent first.
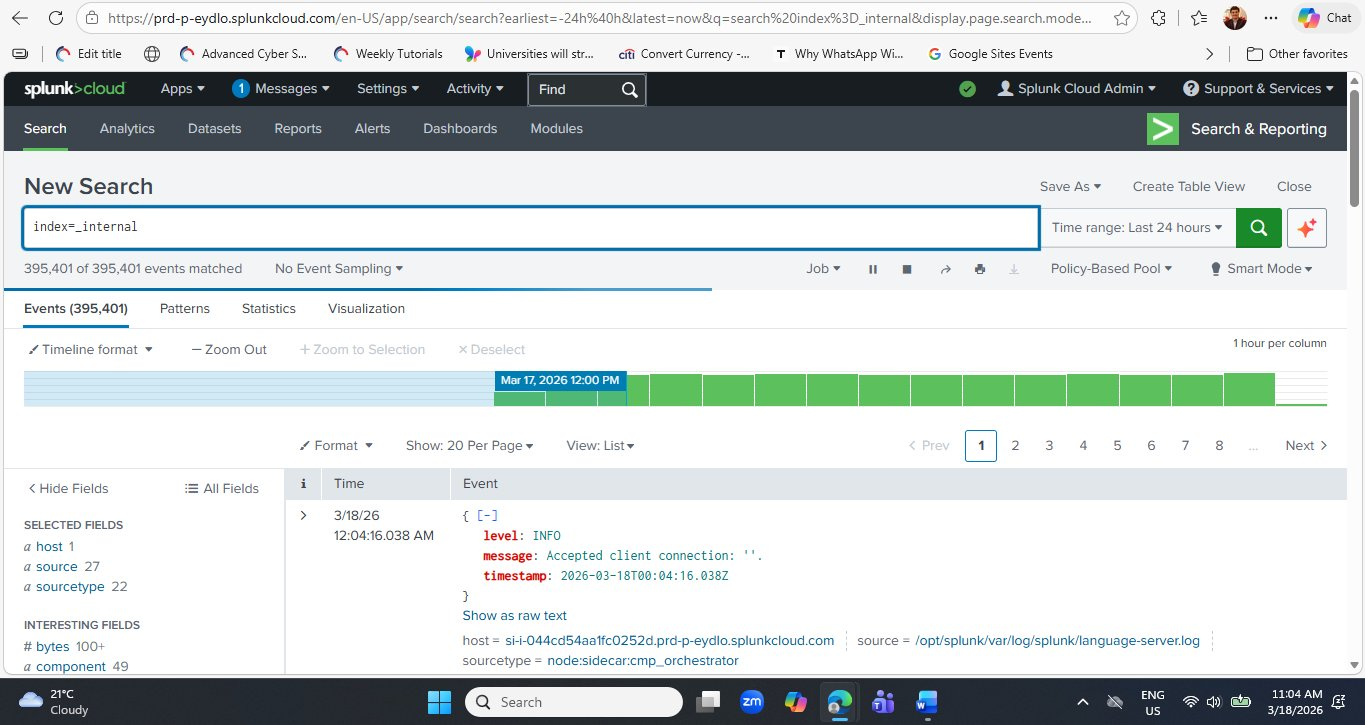
index=_internal. The green timeline bar at the top visualises event density per hour — each column represents one hour of log volume. The most recent event (top of the list) is a JSON-structured entry showing level: INFO and message: Accepted client connection from the node:sidecar:cmp_orchestrator sourcetype. The left panel automatically identifies Interesting Fields including bytes and component.Reading a Raw Internal Event — Key Fields
Look closely at the first event visible in the screenshot. This is a structured JSON log entry from one of Splunk Cloud's internal microservices:
| Field | Value | What It Means |
|---|---|---|
| level | INFO | The severity level of this log entry. INFO means a routine, expected event — not a warning or error. Other levels you will see: DEBUG, WARN, ERROR, FATAL. |
| message | Accepted client connection: '' | The human-readable description of what happened. A new client connected to this internal service — completely normal for a running Splunk Cloud environment with an active admin session. |
| timestamp | 2026-03-18T00:04:16.038Z | The ISO 8601 timestamp of when this event occurred — in UTC (Z = Zulu time / UTC+0). Splunk normalises all timestamps to a consistent format regardless of the original log format, enabling cross-source time correlation. |
| sourcetype | node:sidecar:cmp_orchestrator | Identifies this event as coming from the CMP (Cloud Monitoring Platform) Orchestrator — the Splunk Cloud service that coordinates microservice health and communication. Shown at the bottom of the event card. |
| host | si-044cd54aa1fc0252d.prd-p-eydlo... | The AWS server hostname that generated this log — your dedicated Splunk Cloud EC2 instance. The prd-p-eydlo portion matches your cloud tenant subdomain. |
| source | /opt/splunk/var/log/splunk/language-server.log | The file path on the Splunk server from which this event was read. Splunk always records the originating file path so you can trace any event back to its source log file. |
Notice the timeline bar above the events. In this screenshot, the bar is highlighted in blue at Mar 17, 2026 12:00 PM — this is where the time range boundary falls. A spike in the timeline (a taller column) indicates a sudden increase in log volume during that hour. In security monitoring, unexpected spikes — especially in sourcetypes like splunkd or mongod — can be the first visual sign of a problem worth investigating, even before any search query is written.
Step 10 — Switch to the Visualization Tab
Now run the stats query again and click the Visualization tab to see your data as a chart — the same query, a completely different way of reading the results.
index=_internal | stats count by sourcetype
After the search completes, click the Visualization tab (fourth tab, to the right of Statistics). Splunk automatically renders a Column Chart — the default chart type for a two-column table of categories and counts.
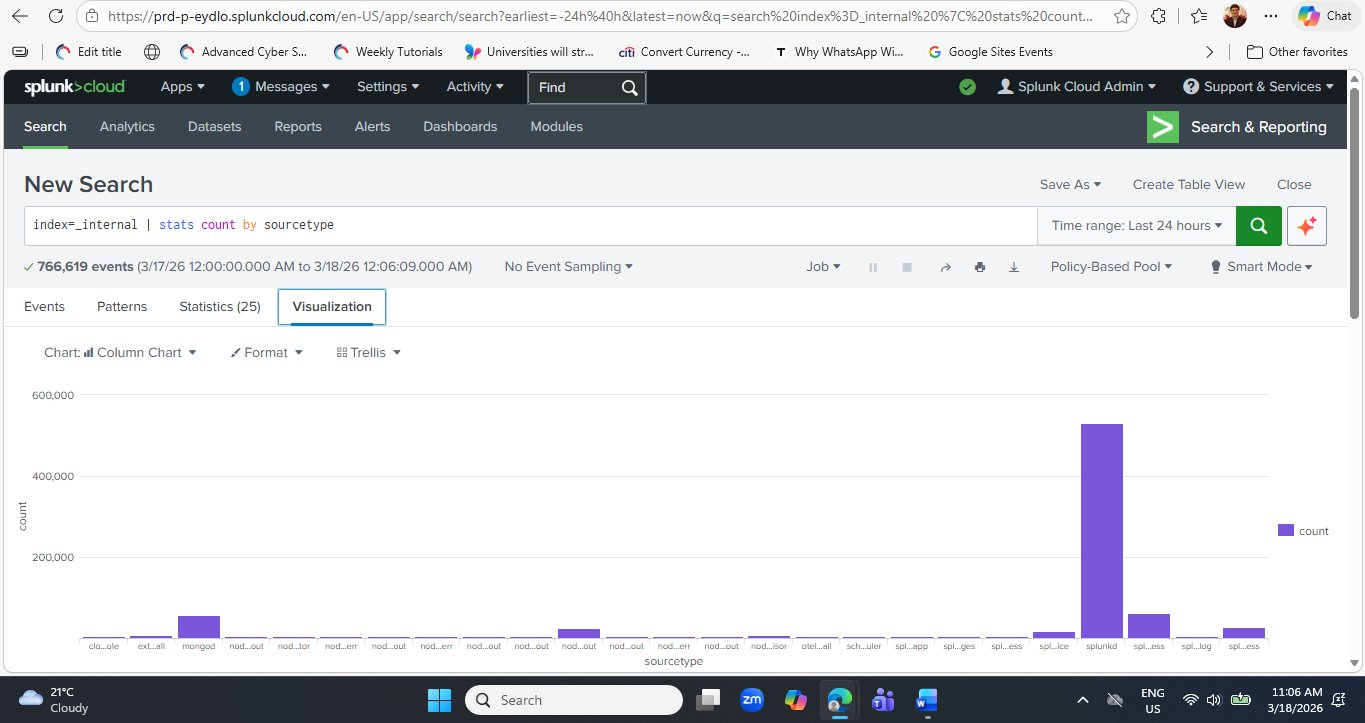
splunkd bar towers over all others at approximately 500,000+ events — immediately communicating Splunk's own daemon is the most active component. The mongod bar is clearly visible as the second-highest. This visual representation of the same data from the Statistics tab makes the dominance of splunkd immediately obvious in a way that a table of numbers does not. Chart type is set to Column Chart — you can change this using the Chart selector dropdown.Once you are happy with a visualization, click Save As → Dashboard Panel to add it to a dashboard. You can either create a new dashboard (name it "Splunk Health Overview") or add it to an existing one. This is how the professional SOC dashboards you saw on the Splunk Cloud signup page are built — one saved visualization at a time. Saving dashboards is covered in detail in Lab 3.
Step 11 — Your First Security-Relevant Query: Detecting Errors by Sourcetype
Everything you have done so far has been exploratory — understanding what data exists and how much of it there is. Now let's write your first query with a security and diagnostic purpose: finding all events that contain the word "error" and grouping them by sourcetype to identify which components are generating the most problems.
This query pattern is directly transferable to real security log analysis — simply replace index=_internal with your own index and error with any keyword, event ID, or threat indicator.
index=_internal error | stats count by sourcetype
Run this query. Splunk will search all 766,619 internal events for any that contain the word "error" (case-insensitive by default) and return a count per sourcetype.
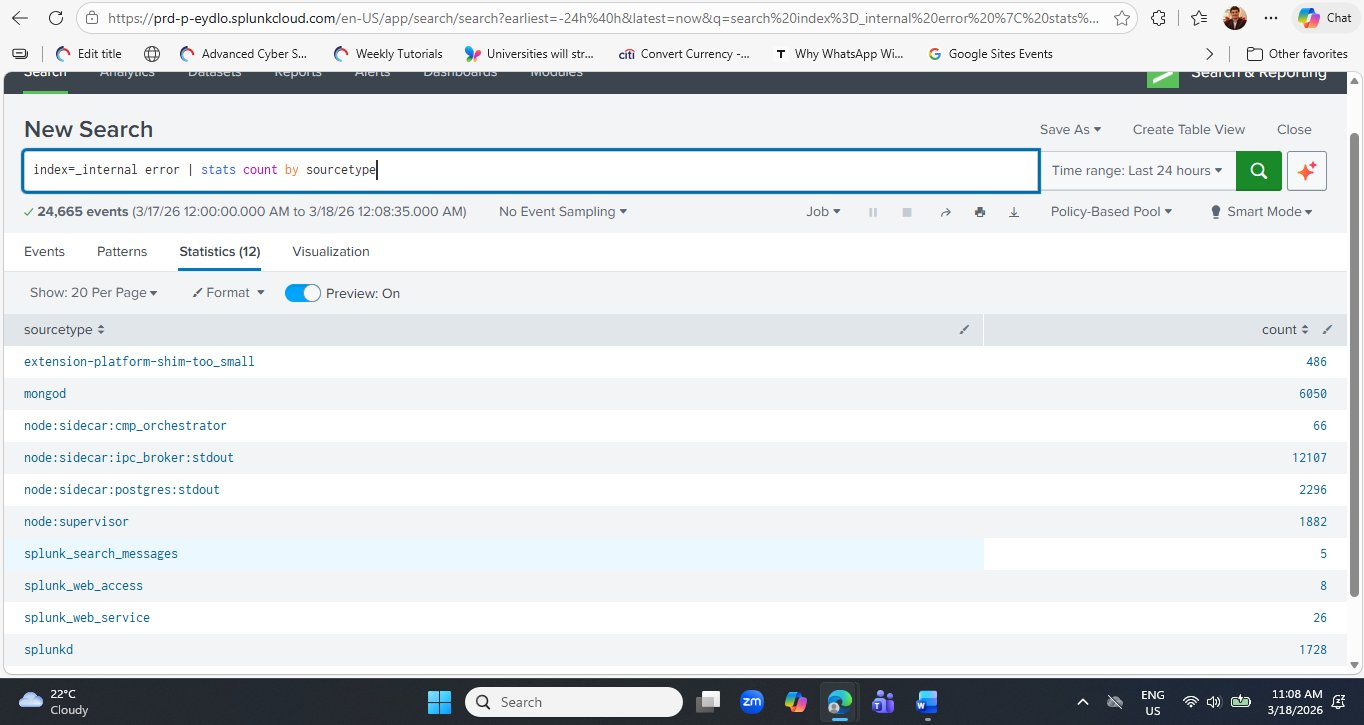
node:sidecar:ipc_broker:stdout component leads with 12,107 error-containing events, followed by mongod at 6,050. The splunkd core daemon shows only 1,728 — a relatively small proportion of its 500,000+ total events, suggesting the Splunk engine itself is running cleanly. Compare this to node:sidecar:ipc_broker:stdout where a large fraction of its total events contain "error."Interpreting the Error Query Results
Let's analyse what these numbers mean — and importantly, how to distinguish normal operational noise from genuine problems:
| Sourcetype | Error Count | Interpretation | Action? |
|---|---|---|---|
| node:sidecar:ipc_broker:stdout | 12,107 | IPC (Inter-Process Communication) broker logs frequently contain the word "error" in routine status messages. In a cloud microservices environment this is expected noise. | Monitor trend |
| mongod | 6,050 | MongoDB logs connection lifecycle messages that contain "error" as part of normal operation strings (e.g., "Error receiving request" during client disconnections). High count is expected. | Baseline normal |
| node:sidecar:postgres:stdout | 2,296 | PostgreSQL internal database logs. Similar to MongoDB — many routine messages include the word "error" as part of normal operational vocabulary. | Baseline normal |
| node:supervisor | 1,882 | The process supervisor that manages Splunk Cloud's microservice processes. Supervisor logs restart events and process exits which may include "error" in status strings. | Monitor trend |
| splunkd | 1,728 | Splunk's core daemon. 1,728 errors out of 500,000+ total events is a 0.3% error rate — healthy. Would require investigation only if this count spikes suddenly. | Healthy rate |
| splunk_search_messages | 5 | Search job error messages — these represent SPL queries that failed or returned errors. Five over 24 hours is very low. Worth drilling into to confirm they are not failed security searches. | Investigate |
This query searches for the word "error" anywhere in the raw event text — this is a keyword search, not a severity filter. A log line that says "No errors detected" would still match this query because it contains the string "error." For production security monitoring, always filter by a structured severity field when available: | where severity="ERROR" or | where level="ERROR". Keyword searching is appropriate for unstructured text logs like syslog; structured severity filtering is more precise for JSON-formatted logs like the ones you see in _internal.
Step 12 — Drill Into a Specific Sourcetype's Errors
To investigate a specific sourcetype's errors in detail, add a sourcetype= filter to the query. Let's look at the splunkd errors specifically — these are the most operationally significant:
index=_internal sourcetype=splunkd error
| table _time, component, log_level, message
| sort -_time
This query returns the most recent splunkd error events as a clean table showing when each occurred, which Splunk component generated it, the log level, and the message. This is the exact pattern a SOC analyst uses when investigating a specific alert — scope to the source, surface the relevant fields, sort newest first.
The pattern index=X keyword | stats count by field is the single most reusable SPL template in all of security operations. Substitute X with any index, keyword with any threat indicator ("Failed password", "4625", "denied", "malware", "unauthorised"), and field with any grouping dimension (src_ip, user, host, dest_port). This one template covers the first 5 minutes of investigation in almost every security incident.
Live Data in Action — Stats Results Update Over Time
One characteristic of Splunk Cloud that surprises new users is how the same query returns different counts each time you run it. This is because Splunk is continuously ingesting new log data — every time you run index=_internal | stats count by sourcetype, the counts will be slightly higher than the previous run.
index=_internal | stats count by sourcetype query run a few minutes later now shows 763,655 events — compared to 785,989 when first run earlier in the session. Wait — that is actually lower? This is because the time range is "Last 24 hours" — as real time advances, the oldest hour rolls out of the 24-hour window while a new hour of data rolls in. In this case the net difference means the rolling window captured fewer total events this run. This behaviour is important to understand when setting alert thresholds: always use a fixed time range for alerting, not a rolling window, to avoid false positives caused by time range drift.The "Last 24 hours" time range is a rolling window — it always ends at right now and starts exactly 24 hours ago. Each time you run the query, the window shifts forward slightly. For operational monitoring this is usually what you want. But for incident investigation — when you need to see exactly what happened between 2 PM and 4 PM yesterday — always use an absolute time range set via the time picker's "Date Range" or "Date & Time Range" options. This ensures your query results are reproducible and stable.
Step 8 — Exploring MongoDB Internal Logs
You noticed that mongod is one of the highest-volume sourcetypes with 59,323 events. Let's drill into these logs to understand what real structured log events look like inside Splunk — and practice the single most important skill in log analysis: reading a raw event and understanding each of its fields.
Run the following query to view the raw MongoDB events:
index=_internal sourcetype=mongod
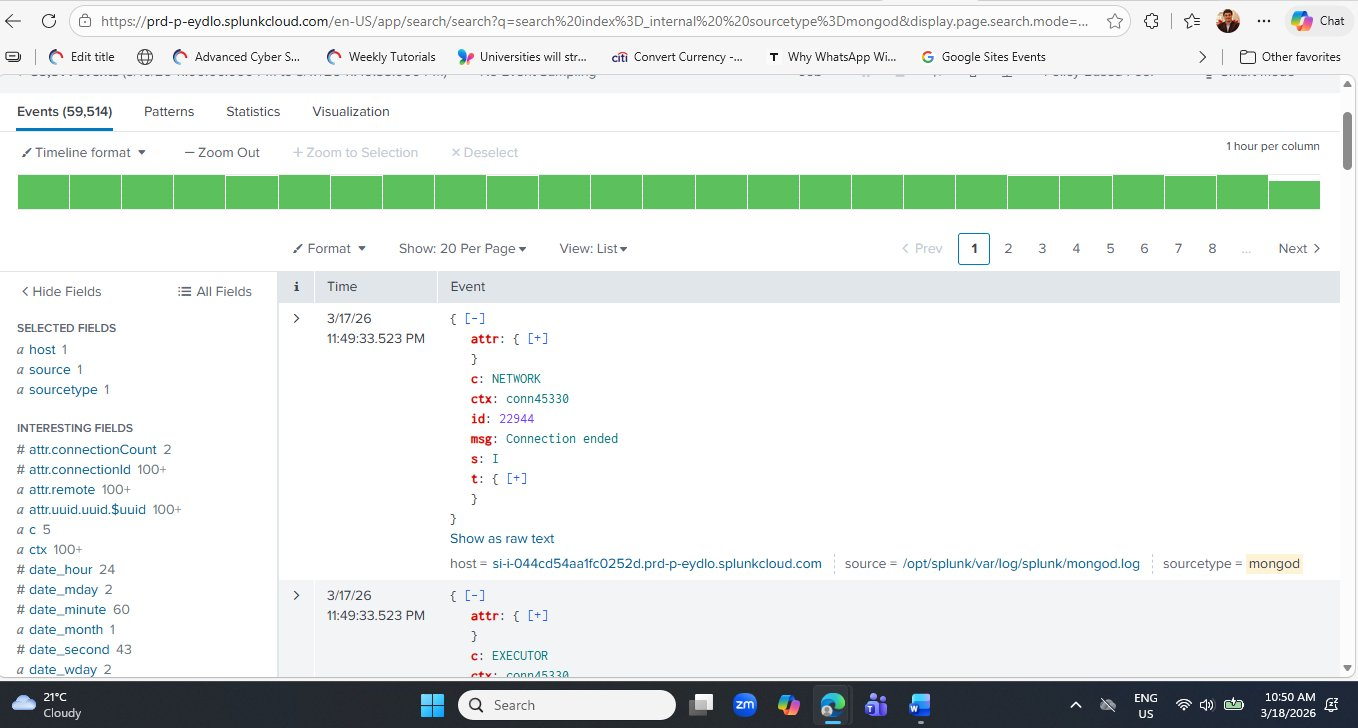
msg: Connection ended and one from the EXECUTOR component.Reading a MongoDB Log Event — Field by Field
Each MongoDB event in Splunk is a structured JSON document. Let's decode every field from the first event visible in the screenshot above:
| Field | Value Seen | What It Means |
|---|---|---|
| c | NETWORK | The MongoDB component that generated this log entry. NETWORK handles client connections. Other values you will see: EXECUTOR, COMMAND, STORAGE, INDEX, REPL. |
| ctx | conn45330 | The context — the specific client connection thread that generated this event. Connection 45330 means this is the 45,330th client connection MongoDB has handled since it started. |
| id | 22944 | MongoDB's internal log event ID. Each distinct message type has a unique ID in MongoDB's structured logging format (introduced in MongoDB 4.4). ID 22944 specifically means "Connection ended." |
| msg | Connection ended | The human-readable log message. This is the most important field for understanding what happened — here it tells us a client connection to MongoDB was cleanly closed. |
| s | I | The log severity level. MongoDB uses single-letter codes: D=Debug, I=Informational, W=Warning, E=Error, F=Fatal. "I" (Informational) means this is a normal, expected event — not an error. |
| t | {+} | The timestamp object — expandable to see the exact date and time of the event in ISO 8601 format. |
| attr | {+} | Additional attributes specific to this event type. For connection events, attr contains fields like connectionId, remote (the client IP address), and connectionCount (total active connections at the time). |
A common student reaction when seeing "Connection ended" or "Error receiving request" in MongoDB logs is to assume something is wrong. In practice, connection lifecycle events (opened, ended) are generated constantly in any active database system and are entirely normal. The key analytical skill is recognising the severity level (s: I = Informational, not an error) and the connection count context — a sudden spike in connection-ended events could indicate a problem, but isolated occurrences during normal operation are expected.
Step 9 — Try a More Specific MongoDB Search
Now let's try the error-specific query from the theory document — searching for MongoDB connection errors by host:
index=_internal sourcetype=mongod "Error receiving request"
| stats count by host
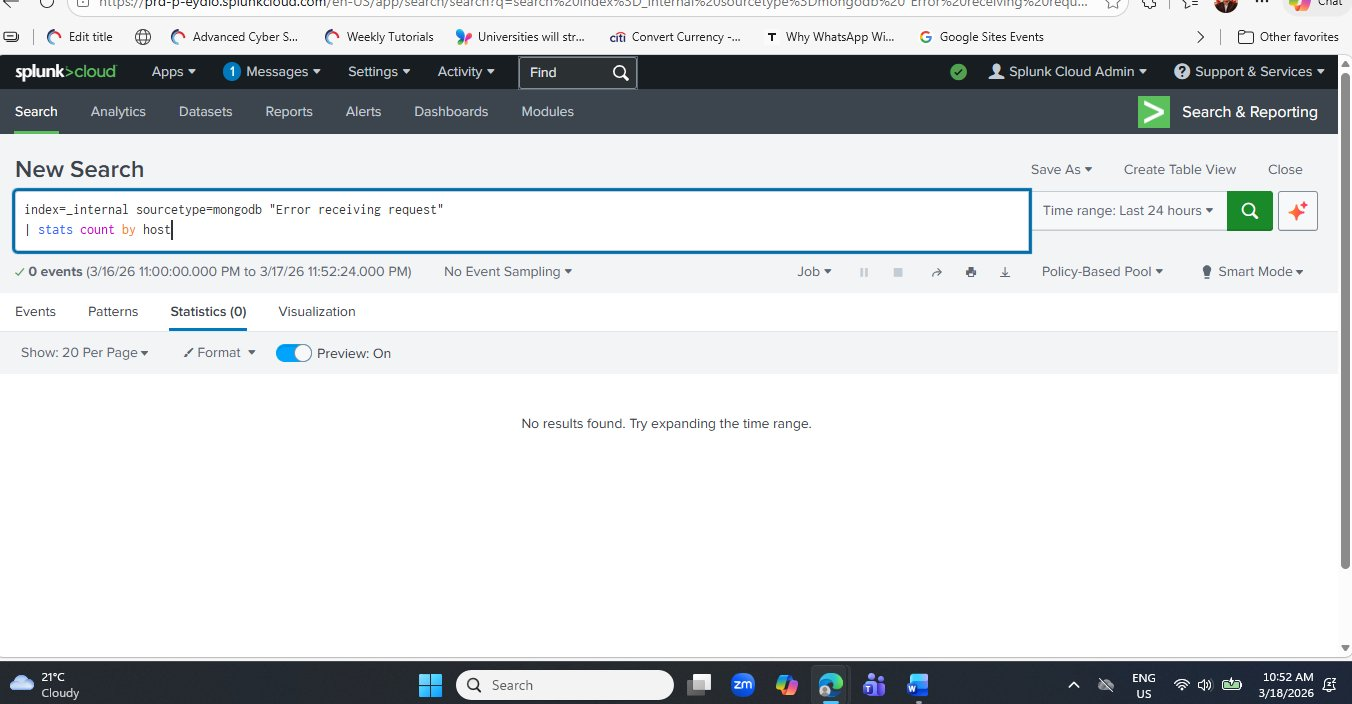
Students often assume a search that returns zero results is broken. This is a critical misconception to correct. In security monitoring, zero results from an error or threat detection query means the specific condition being searched for has not occurred — which is the desired outcome. A well-tuned SIEM is one where most alert queries return zero results most of the time. When a detection does return results, it demands immediate attention.
Step 10 — Sample Log Files for Student Practice
Now that you have explored Splunk's internal data, the next stage is ingesting your own log files. The following three sample datasets cover the most common log types used in cybersecurity labs. Save each one as a plain text file and upload via Settings → Add Data → Upload.
Dataset 1 — Apache Web Server Log (apache_log.txt)
This dataset simulates Apache HTTP server access logs — the primary log source for detecting web application attacks, brute force login attempts, and directory traversal. Note the multiple failed login attempts from IP 192.168.1.11 — a pattern your students will detect using SPL in the next lab.
192.168.1.10 - - [18/Mar/2026:10:00:01 +0000] "GET /index.html HTTP/1.1" 200 1024
192.168.1.11 - - [18/Mar/2026:10:01:15 +0000] "POST /login HTTP/1.1" 401 512
192.168.1.12 - - [18/Mar/2026:10:02:20 +0000] "GET /admin HTTP/1.1" 403 256
192.168.1.10 - - [18/Mar/2026:10:03:05 +0000] "GET /dashboard HTTP/1.1" 200 2048
192.168.1.13 - - [18/Mar/2026:10:04:10 +0000] "GET /login HTTP/1.1" 200 1024
192.168.1.11 - - [18/Mar/2026:10:05:30 +0000] "POST /login HTTP/1.1" 401 512
192.168.1.11 - - [18/Mar/2026:10:06:45 +0000] "POST /login HTTP/1.1" 401 512
192.168.1.14 - - [18/Mar/2026:10:07:50 +0000] "GET /home HTTP/1.1" 200 1024
192.168.1.12 - - [18/Mar/2026:10:08:22 +0000] "GET /config HTTP/1.1" 403 256
192.168.1.15 - - [18/Mar/2026:10:09:30 +0000] "GET /contact HTTP/1.1" 200 512
Dataset 2 — SSH Authentication Log (ssh_log.txt)
This dataset replicates Linux /var/log/auth.log SSH entries. It contains a classic brute force pattern: multiple failed attempts from 192.168.1.50 against the root account, followed by a successful login from 192.168.1.51 — the exact scenario covered in Lab 1 of this series.
Mar 18 10:01:01 server sshd[1234]: Failed password for root from 192.168.1.50 port 22 ssh2
Mar 18 10:01:05 server sshd[1235]: Failed password for root from 192.168.1.50 port 22 ssh2
Mar 18 10:01:10 server sshd[1236]: Failed password for admin from 192.168.1.51 port 22 ssh2
Mar 18 10:01:15 server sshd[1237]: Failed password for root from 192.168.1.50 port 22 ssh2
Mar 18 10:01:20 server sshd[1238]: Accepted password for admin from 192.168.1.51 port 22 ssh2
Mar 18 10:01:25 server sshd[1239]: Failed password for root from 192.168.1.52 port 22 ssh2
Mar 18 10:01:30 server sshd[1240]: Failed password for root from 192.168.1.50 port 22 ssh2
Dataset 3 — Application Event Log (app_log.txt)
A generic structured application log showing INFO, ERROR, and WARNING severity levels. This is the simplest dataset — excellent for teaching basic stats and timechart queries to students who are brand new to SPL.
2026-03-18 10:00:01 INFO  User login successful user_id=101
2026-03-18 10:01:05 ERROR Login failed user_id=102
2026-03-18 10:02:10 WARNING Password attempt limit nearing user_id=102
2026-03-18 10:03:20 INFO  User accessed dashboard user_id=101
2026-03-18 10:04:30 ERROR Database connection failed
2026-03-18 10:05:45 INFO  File uploaded successfully user_id=103
2026-03-18 10:06:50 ERROR Unauthorized access attempt detected
After uploading all three files, practice these starter queries against your new data:
# 1. Find all 401 Unauthorized responses in Apache logs
index=main 401

# 2. Detect SSH brute force — count failed attempts by source IP
index=main "Failed password"
| stats count by host

# 3. Find all application errors
index=main ERROR

# 4. Count events over time — creates a time-series chart
index=main | timechart count

# 5. Count events grouped by IP address
index=main | stats count by host
Teaching Notes — Explaining This Lab to Students
This section is written specifically for instructors delivering this content in a classroom setting. The following notes translate directly into talking points, activities, and interactive questions for each major step of the lab.
Opening Hook Start with the Big Picture
Begin by saying: "Splunk is a tool that reads logs and helps us understand what is happening in a system. Think of it like a search engine for log files — except instead of searching the web, you are searching every event that has happened across every system in an organisation." This frames Splunk immediately as purposeful rather than abstract.
Analogy The Email Inbox Analogy for Sourcetypes
When explaining sourcetypes, use: "Think of this like counting how many emails you received from Gmail, Outlook, and Yahoo — each sourcetype is a category of log, and the count is how many times that category generated an event." Students who have never seen a log file immediately understand the grouping concept.
Interactive Q&A Questions for the Stats Results Table
After students see the sourcetype counts, ask: (1) Which sourcetype has the highest log count, and why? (2) What does a high MongoDB log count tell us about how Splunk stores its data? (3) If you saw splunkd suddenly drop from 544,000 to 50 events, what might that indicate? These questions reinforce critical thinking rather than passive observation.
Key Line Connecting Logs to Security
Bridge from internal logs to real security monitoring with: "In a real Security Operations Centre, analysts use exactly this type of query — but instead of searching Splunk's own internal index, they are searching logs from every server, firewall, and cloud service across the organisation. The query structure is identical; only the index and sourcetype change."
Zero Results Teaching the Right Mindset
When the MongoDB error search returns zero results, use it as a teaching moment: "Zero results from a threat detection query is the desired outcome. A well-tuned SIEM is quiet most of the time. When it does produce results from a security query, it demands your immediate, full attention — because something genuinely abnormal has been detected."
Mini Lab Task Student Assessment Activity
Issue this as a 10-minute in-class task: Run index=_internal | stats count by sourcetype. (1) Which sourcetype has the highest event count? (2) What does mongod represent in this environment? (3) What does a high splunkd count indicate about platform health? Submit your answers with a screenshot of your results table. This covers observation, interpretation, and documentation — three core SOC skills.
"Here we are using Splunk to analyse system logs. This query counts how many log events are generated by different components of the Splunk platform itself. Each row in the results table represents a log category — called a sourcetype — and the count column shows how active that component has been in the last 24 hours. In cybersecurity, unusually high counts or sudden changes in these numbers can indicate heavy usage, a performance issue, or in some cases, suspicious activity. This is the first step in all log analysis — understanding what data exists, where it comes from, and how much of it there is."
Frequently Asked Student Questions
Is Splunk Cloud Platform free to use?
Yes. The 14-day free trial requires no credit card and gives full platform access. After the trial, Splunk offers a free licence with a 500 MB per day ingest limit — sufficient for all student lab work. The trial can be renewed by registering a new email, though for sustained use the free licence is recommended.
Why does mongod have so many log entries?
Splunk uses MongoDB as its internal configuration database — storing knowledge objects, saved searches, dashboards, and app configuration. MongoDB logs every read and write operation, as well as every client connection opened and closed. In an active Splunk Cloud environment, this generates tens of thousands of entries per day even with no user activity, purely from internal housekeeping operations.
What is the difference between index=main and index=_internal?
index=_internal contains Splunk's own operational logs — data about Splunk itself. index=main is the default index where external data you upload (your Apache logs, SSH logs, etc.) is stored. When you run queries for security analysis, you will almost always use named indexes like index=main or custom indexes like index=linux_auth — not _internal, which is reserved for platform diagnostics.
Can I use Splunk for real cybersecurity work with the free trial?
Absolutely. The Splunk Cloud free trial and free licence are fully functional — there is no artificial limitation on features, only on the volume of data you can ingest per day (500 MB on the free licence). Professional SOC analysts use the same SPL commands, the same data types, and the same dashboard tools available in the free version. Every skill you learn in these lab sessions is directly transferable to enterprise Splunk deployments.
Conclusion & Learning Outcomes
In this lab you completed the full onboarding journey into Splunk Cloud Platform — from the registration form through to running live queries against real internal log data. You verified your email, received cloud credentials, changed your password on first login, navigated the platform UI, ran your first SPL query, interpreted a statistics table of 24 distinct sourcetypes totalling 785,989 events, read raw MongoDB JSON log events field by field, and correctly interpreted a zero-result security query as a positive finding.
These foundational skills are the exact starting point for every SOC analyst, threat hunter, and Splunk developer. The platform confidence gained in this lab makes every subsequent lab in this series significantly easier — because the environment is familiar, the navigation is intuitive, and the query language has started to feel natural.
After this lab, you can:
- Register for a Splunk Cloud Platform free trial and navigate the account verification and provisioning process
- Log in to Splunk Cloud for the first time, change a temporary password, and access the platform home page
- Identify the key areas of the Splunk Cloud UI: Apps panel, Search & Reporting, Settings, and common tasks
- Write and execute a basic SPL query using
index=_internal | stats count by sourcetype - Explain what each part of an SPL query does — the index scope, the pipe operator, and the stats aggregation command
- Interpret a Splunk statistics results table and sort results by event count
- Identify and explain the six highest-volume sourcetypes in a fresh Splunk Cloud environment
- Read a raw MongoDB log event and explain the meaning of fields:
c,ctx,id,msg,s, andattr - Correctly interpret a zero-result search as evidence of absence rather than a query error
- Upload sample log files into Splunk and run basic detection queries against them
SPL Commands Covered in This Lab
In Lab 3 we will upload the three sample log files from Step 10 into Splunk, run real attack detection queries including SSH brute force identification with stats count by host, build your first Splunk visualisation chart, and save it as a dashboard panel — the building blocks of a real SOC monitoring interface.

Dr Pritam Gajkumar Shah
Dr. Pritam Gajkumar Shah is an Australian-based computer science academic and cybersecurity specialist with extensive experience in teaching, research, and curriculum development in information technology and cyber security. He holds a Ph.D. in Information Sciences and Engineering from the University of Canberra, where his research focused on elliptic curve cryptography for resource-constrained wireless sensor networks. Dr. Shah has taught a wide range of cybersecurity, cloud computing, digital forensics, and networking units across several Australian higher education institutions and has contributed to the development of numerous IT programs. He is the founder of CyberPritam, a global cybersecurity learning platform that has provided free practical training to thousands of international students, and AusJournal, an academic publishing initiative supporting research dissemination and technical education. His work focuses on practical, lab-oriented cybersecurity education, integrating tools such as Kali Linux, Splunk Cloud Platform, Wireshark, Python, and cloud security environments to prepare students for real-world security challenges.